Explainer
How VLBI works
from a balloon
To turn a telescope hanging under a stratospheric balloon into one element of an Earth-sized instrument, three things have to be true at once. You have to know where it is, you have to know what time it is, and you have to keep every sample.
The short version
One wave period at 22 GHz lasts 45 picoseconds. Two telescopes only produce a fringe if their clocks agree to a small fraction of that, and a balloon adds motion, temperature swings and a position that never stops changing. BVEX is the instrument we built to hold all of it steady enough to try.
An interferometer measures a delay, not a picture
Two antennas point at the same source. Because they sit in different places, the incoming wavefront reaches one before the other. That difference in arrival time is the geometric delay, and for a baseline b and a source at angle θ from the baseline normal it is τ = b sin θ / c.
Everything else follows from measuring τ precisely. Correlating the two recordings produces a fringe, the fringe position encodes the delay, and the delay encodes where the source sits on the sky. Repeat that across many baselines as the Earth turns and you can reconstruct an image.
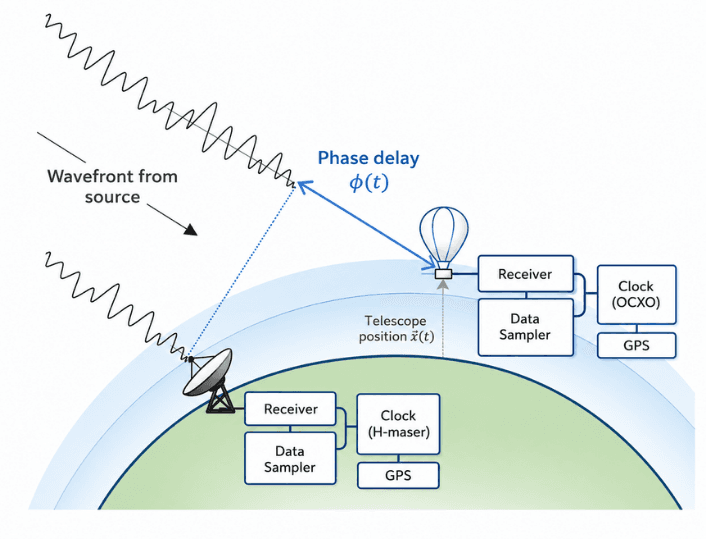
The payoff is resolution. A single dish resolves detail at roughly λ/D, set by its own diameter. An interferometer resolves at λ/B, set by the separation between elements. At 22 GHz the wavelength is 13.6 mm, so a dish three metres across resolves about 16 arcminutes, while a 1,000 km baseline resolves about 2.8 milliarcseconds. That is a factor of a few hundred thousand, and it is the entire reason the technique exists.
The cost is that nothing is real until the recordings are brought together and correlated. Each station records blind, against its own clock. If the clocks disagree, there is no fringe and no way to tell that from an absent source.
Why put one of the antennas in the stratosphere
Water vapour is the problem. It absorbs radio signals and it delays them, and because it moves, the delay it adds keeps changing. Both effects get worse as frequency rises, which is why the sharpest radio observations are also the ones most limited by weather.
Water vapour is also concentrated near the ground. Almost all of it sits in the troposphere, below about 12 km. A balloon floating near 40 km is above roughly 99 percent of the atmosphere by mass and above essentially all of its water, so the signal path above the telescope is far steadier than anything available from a mountaintop.
There is a second reason, and it is about geometry rather than transparency. Ground baselines are limited to the Earth. A station that flies gives an array baselines it could not otherwise have, and doing that cheaply on a balloon is a step toward doing it properly from space.
What you give up is the ground’s greatest luxury: standing still. Everything in the rest of this piece follows from that trade.
Problem one: knowing where the telescope is
The delay τ depends on the baseline. On the ground the baseline is a surveyed constant. Under a balloon it changes continuously, and the correlator needs it well enough that the residual error stays small compared to a wavelength. At 22 GHz a wavelength is 13.6 mm, which sets an uncomfortable standard.
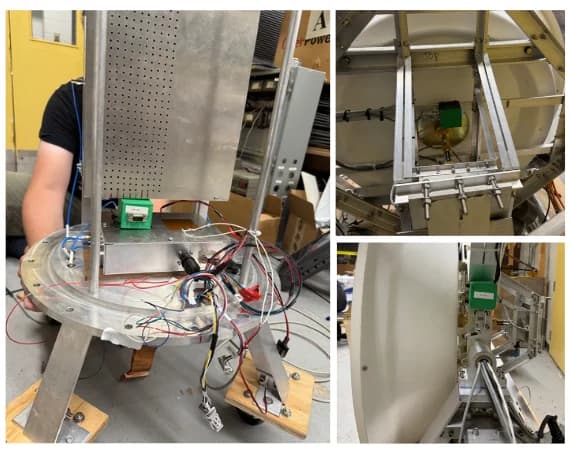
We split the problem in two. Absolute position comes from GNSS, and the requirement is better than one metre on one-second timescales, which a dual-antenna receiver reaches comfortably. The residual, the part that matters at the millimetre level, is recovered after the flight from the fringe itself. What the instrument has to supply is a continuous, well-timed record of its own motion so that the search has somewhere to start.
- GNSS receiver
- Hemisphere VEGA 40, dual antenna on a 2 m baseline
- Position accuracy
- 1 m RMS, updated at 10 Hz
- Heading precision
- 0.04 degrees from the antenna pair
- Stability target
- 40 µm over 0.1 s, 100 µm over 1 s
- Vibration sensing
- 3× ADXL355 at 1 kHz, plus a 22 kHz wideband channel
- Pointing check
- Star camera solving to better than 5 arcseconds
The star camera is the part that ties the payload to the sky rather than to the Earth. It takes short exposures, finds stars, and solves the field astrometrically in under two seconds, which gives an absolute check on where the telescope is actually looking rather than where the motors believe they have pointed it.
Problem two: agreeing on time to a fraction of a wave
This is the constraint that shapes the whole instrument. A fringe is an interference pattern, so it only survives if the phase relationship between the two stations holds over the integration. Random clock error of RMS σt becomes phase error σφ = 2πνσt, and averaging over that scatter suppresses the fringe amplitude by exp(−σφ²/2).
At 22 GHz a full cycle takes 45 picoseconds. Put a few tens of picoseconds of jitter into that expression and the fringe is gone. The demonstration below is that calculation, and it is worth switching between bands to see how much harder the problem becomes as frequency rises.
Try it
How much clock error erases a fringe
Pick an observing band, then add timing error between the two clocks. The curve is the fringe an ideal correlator would measure.
BVEX. Water maser band.
- One wave period
- 45 ps
- Phase error
- 0.83 rad
Fringe amplitude
71%
of a perfectly clocked pair
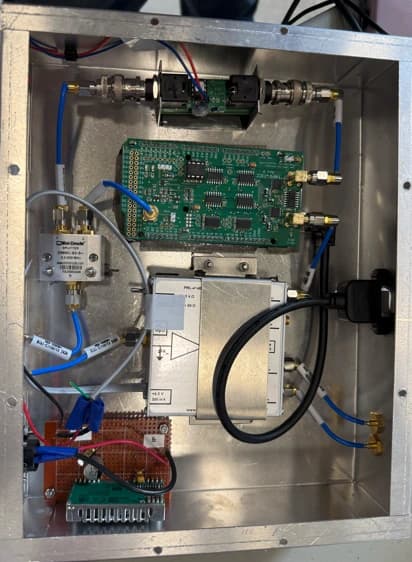
The instrument answers this with a reference chain rather than a better clock alone. A 10 MHz oven-controlled crystal oscillator provides short-term stability, GPS provides absolute time through its one pulse per second output, and a TAPR TICC time interval counter continuously measures the phase between the two at 60 picosecond resolution.
The TICC log is not used to steer anything during flight. It is recorded so that correlation after the flight can remove the oscillator’s drift from the data. The oscillator only has to be predictable over the integration, not correct in absolute terms, and an OCXO with an Allan deviation near 7×10⁻¹¹ at one second is predictable enough for that.
Problem three: keeping every sample
VLBI cannot average on the fly. Correlation happens later and needs the raw voltage stream from both stations, so the payload has to record everything and lose nothing.
The 22 GHz sky signal is downconverted to a 2 to 4 GHz intermediate frequency and digitised by an AMD Xilinx RFSoC Gen3 at 5 gigasamples per second, 14 bits per sample. Nothing on a balloon can store that. So the samples are requantised to 2 bits, which is the standard trade in VLBI: sensitivity drops by a modest and well understood factor while the data rate falls by seven. The result is packetised with timestamps, streamed over 100 gigabit Ethernet, and written to two 8 TB NVMe drives.
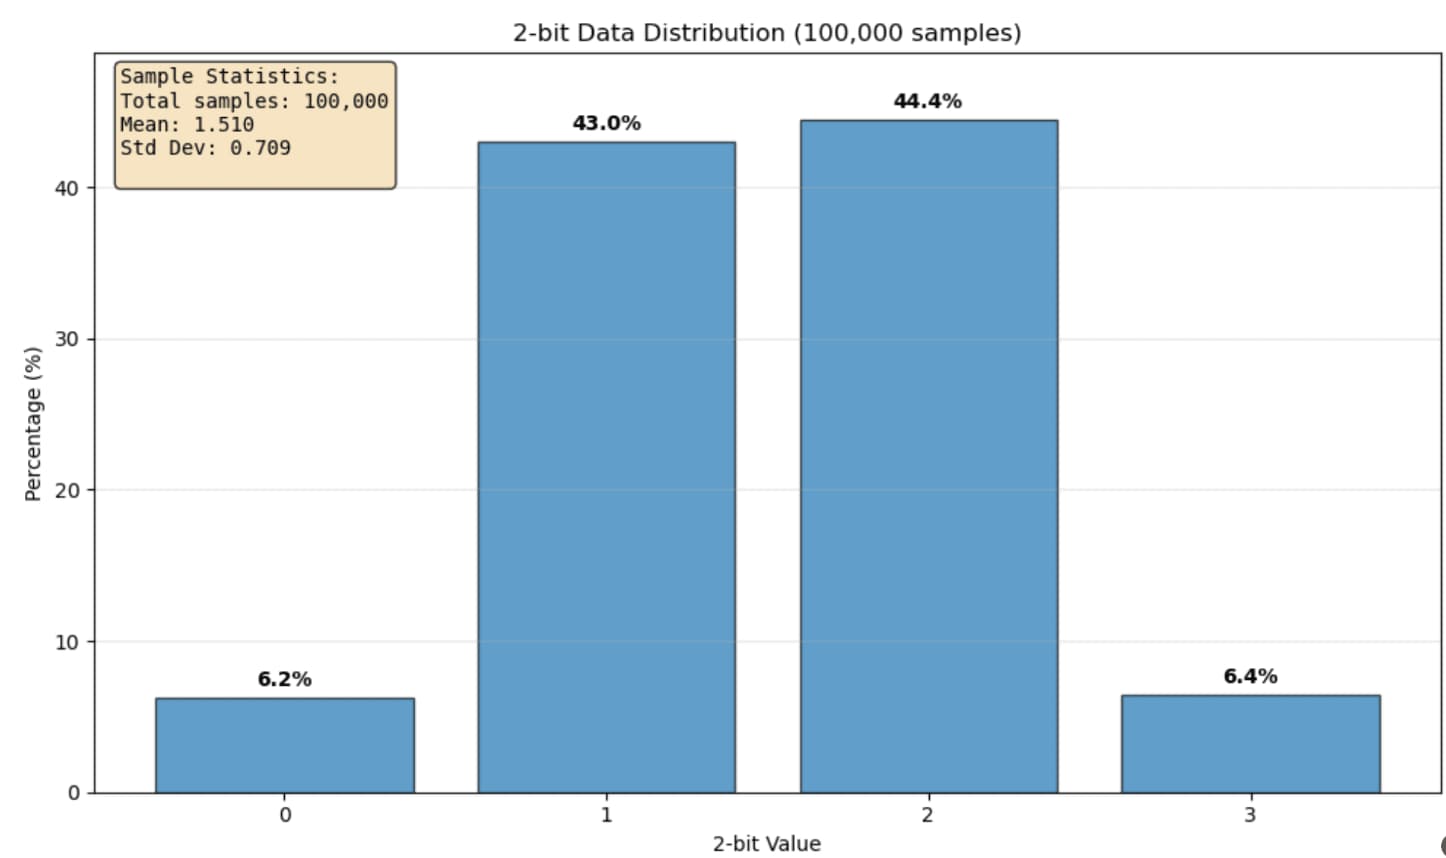
Two-bit sampling sounds lossy to the point of absurdity until you look at what a histogram of the digitised noise should be. The signal is Gaussian, the thresholds are set against its measured RMS, and if the level control is right the four states are populated in the proportions theory predicts. Checking that histogram is the fastest way to know the backend is healthy.
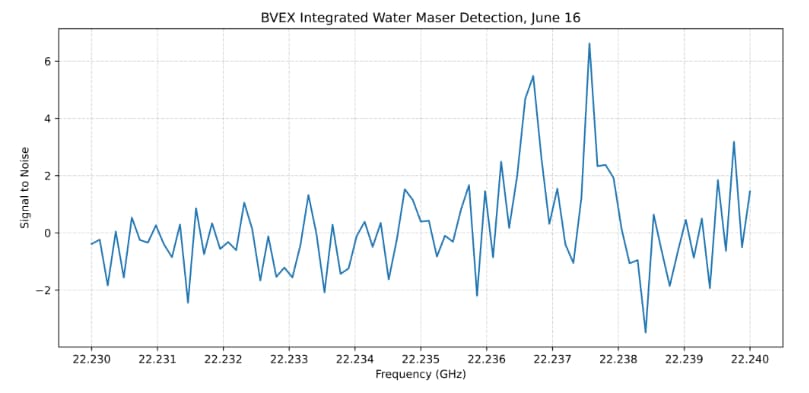
The same backend also runs a 2048-point polyphase filterbank spectrometer in parallel, which is what makes the payload useful as a telescope in its own right rather than only as a recorder. That is where the observations below came from.
What actually happened in August 2025
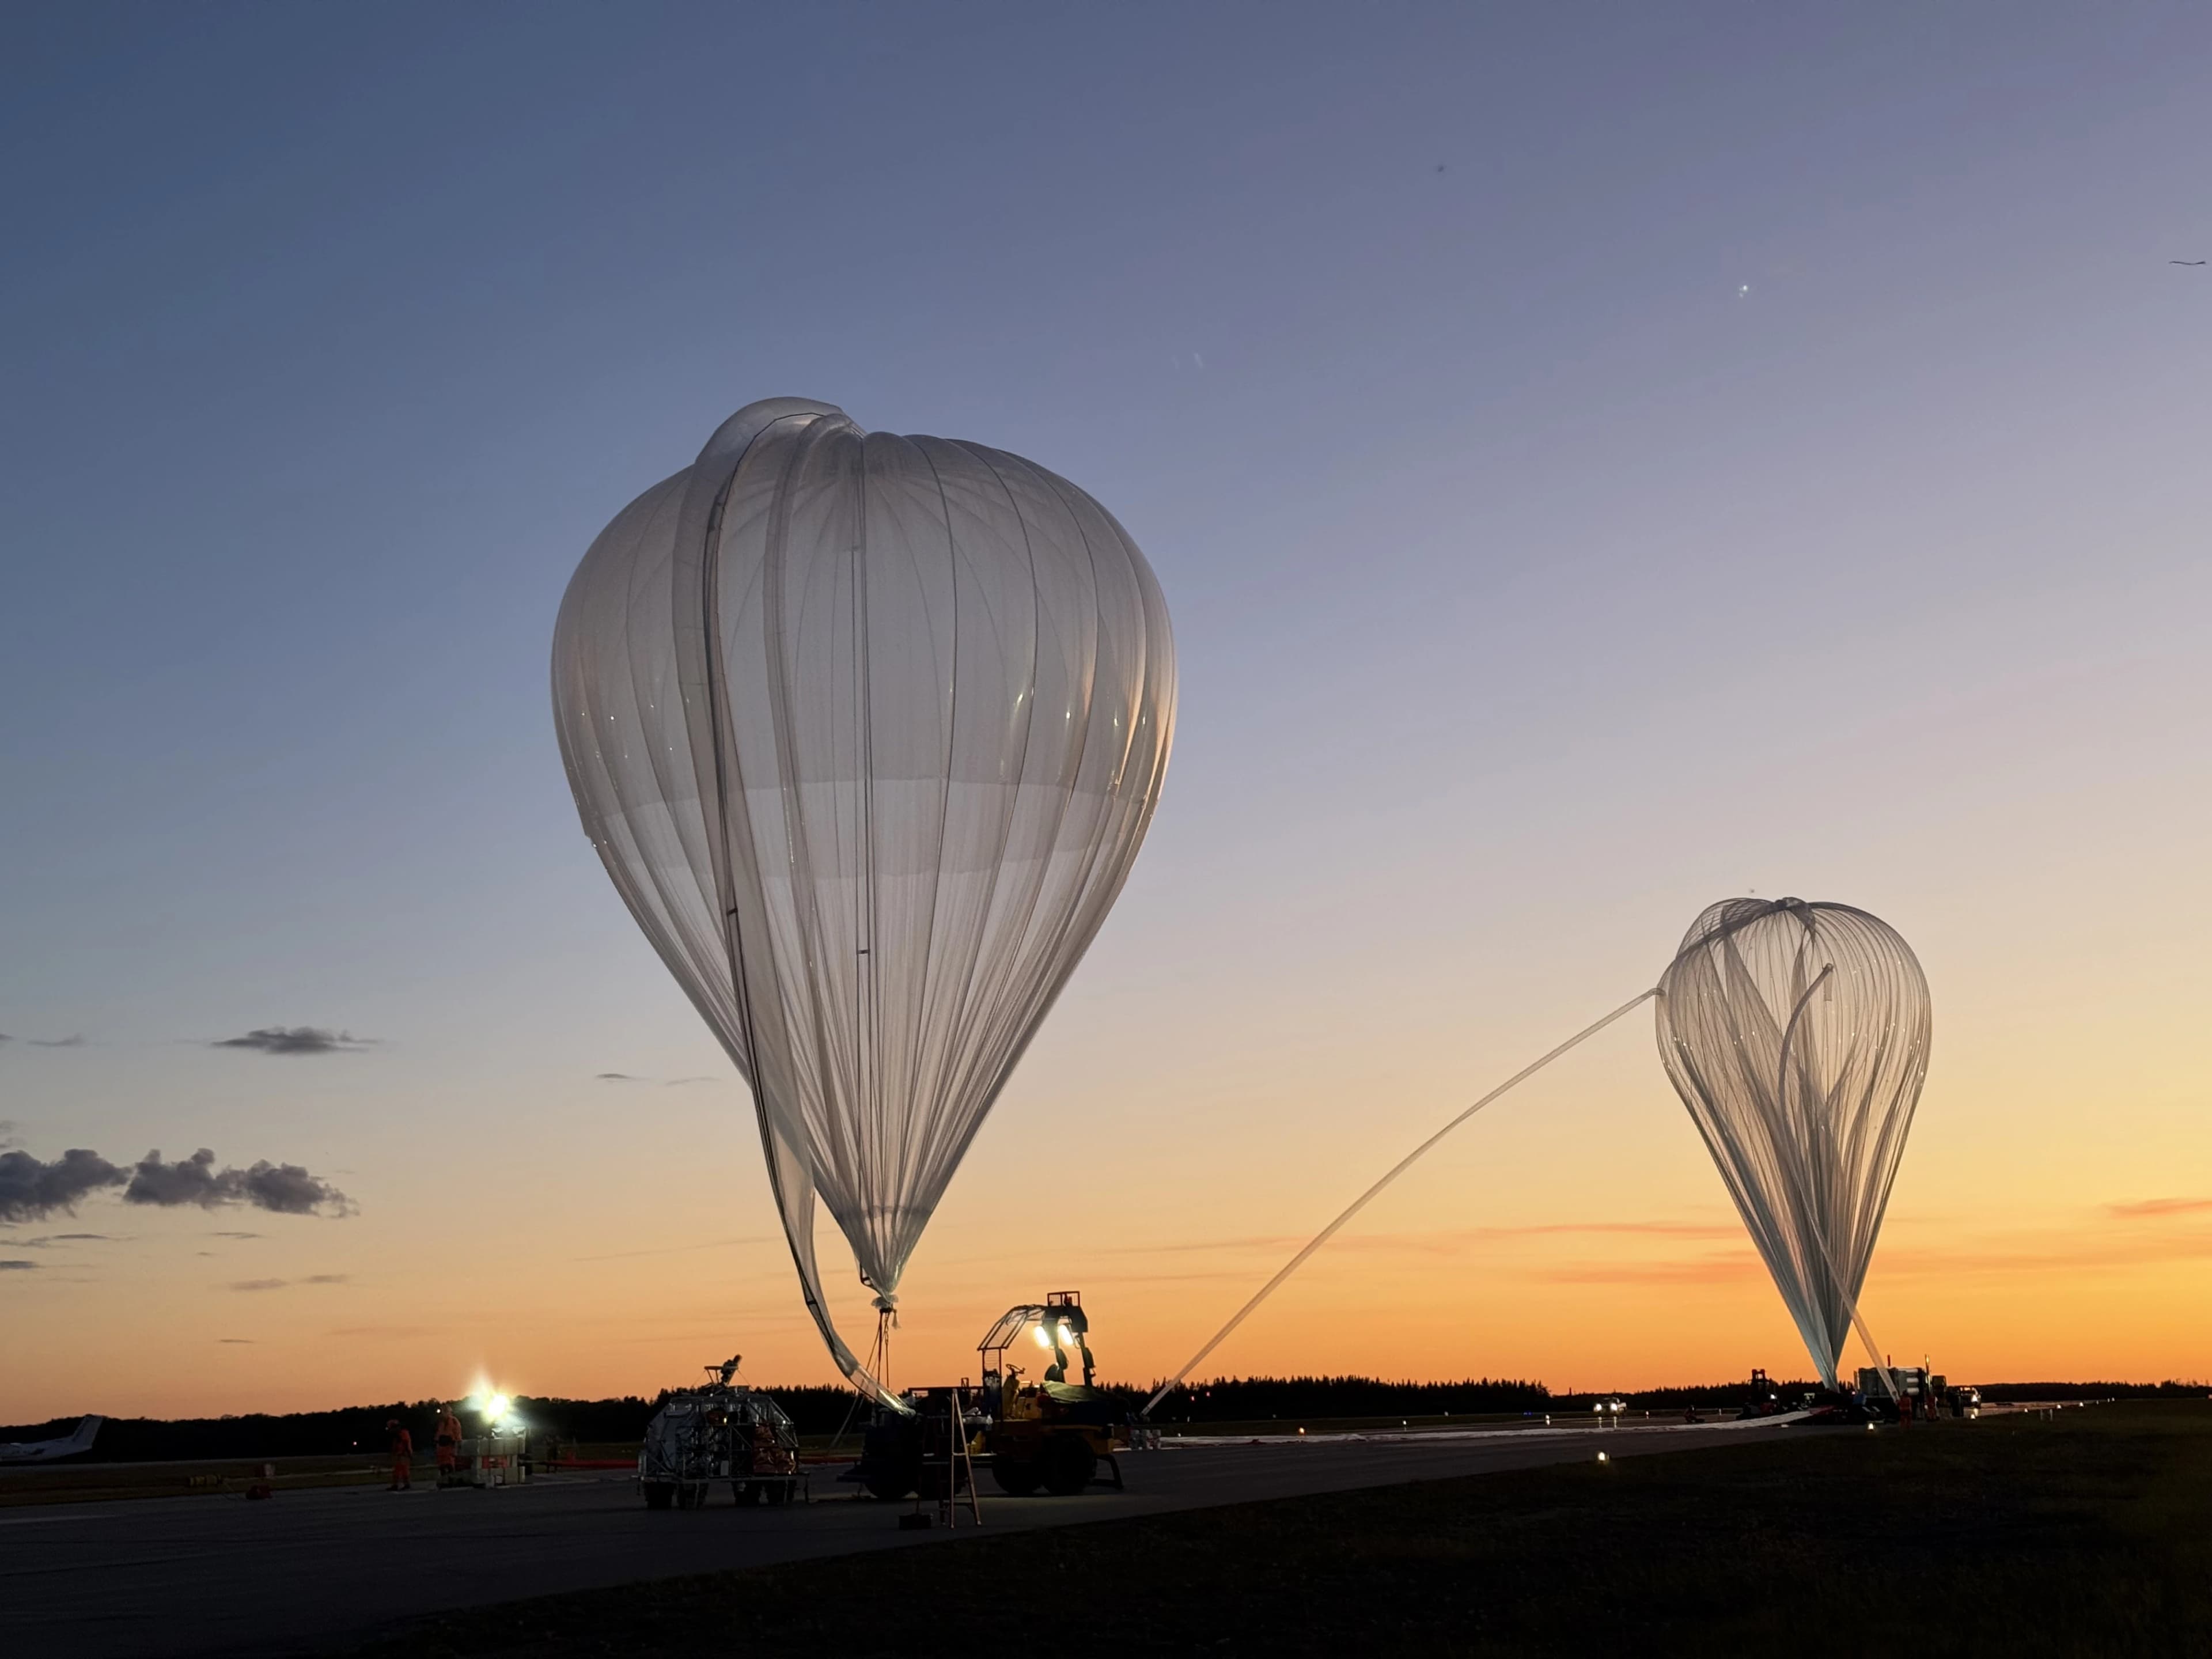
BVEX launched from Timmins, Ontario as part of the CNES and CSA STRATOS campaign. The flight did not go as planned. A leak in the balloon envelope meant the payload never reached float altitude, and the flight was terminated early because it was drifting rapidly toward restricted airspace near Sudbury.
No VLBI correlation was obtained. That is the honest summary, and it is worth stating plainly because the interesting part of a pathfinder flight is usually what it teaches rather than what it proves. The payload powered up, the thermal control held through the cold of the ascent, the housekeeping system reported from all its channels, and the pointing and telemetry chains behaved the way they had on the ground.
The gap between a system that works on a bench and a system that works while hanging from a balloon at −60 °C is the whole engineering problem, and the only way to measure it is to fly. A second payload is being built with what the first one taught us, with a flight targeted for 2027.
questions
- What is VLBI?
- Very Long Baseline Interferometry combines signals from radio telescopes separated by large distances. Each telescope records the sky signal against its own clock, and the recordings are combined afterwards. The angular resolution follows the separation between telescopes rather than the size of any single dish, so a network spread across a continent resolves detail no single antenna could reach.
- Why fly a VLBI station on a balloon?
- Water vapour in the troposphere absorbs and delays radio signals, and the delay fluctuates. Both effects worsen with frequency. A balloon floating near 40 km sits above roughly 99 percent of the atmosphere by mass and above essentially all of its water vapour, so a balloon-borne station sees a much steadier signal path than any ground site. It also adds a baseline that no ground array can reach.
- Why is timing the hard part of high-frequency VLBI?
- Fringes only appear if the two stations agree on time to a small fraction of one wave period. At 22 GHz one period is about 45 picoseconds, so a clock error of even a few tens of picoseconds erases the signal. BVEX carries a 10 MHz oven-controlled crystal oscillator disciplined against GPS, and a TAPR TICC time interval counter that logs the phase between them at 60 picosecond resolution for use in post-flight correlation.
- How much data does BVEX record?
- The RFSoC digitises a 2 to 4 GHz intermediate frequency band at 5 gigasamples per second and 14 bits, then requantises to 2 bits, which is the standard trade in VLBI because sensitivity falls only modestly while the data rate drops by a factor of seven. The result streams over 100 gigabit Ethernet to two 8 TB NVMe drives, 16 TB total, on a fanless flight computer.
- What happened on the August 2025 BVEX flight?
- BVEX launched from Timmins, Ontario as part of the CNES and CSA STRATOS campaign. A leak in the balloon envelope prevented the payload from reaching float altitude, and the flight was terminated early because the payload was drifting rapidly toward restricted airspace near Sudbury. The VLBI correlation was not achieved. The flight returned engineering data on the payload's thermal, power and pointing behaviour that is being used to rebuild the experiment for a 2027 flight.